
Repeatability
R package ICC
The intraclass correlation coefficient (ICC) is a commonly used and widespread summary statistic. The ICC is a ratio of variances and measures repeatability and can also be used to assess measurement error. Both of these uses are popular across a very diverse range of scientific fields, such as: agricultural production and animal health, human health, geology, biochemistry, psychology, and ecology & evolutionary biology.
I have created the R package, ICC to be used during the planning of experiments and the analysis of data to estimate the intraclass correlation coefficient (Wolak et al. 2012). The package includes functions to 1) estimate the ICC and it's associated confidence limits and 2) calculate the n number of individuals/groups necessary to estimate the ICC, given k number of observations per individual/group and a desired confidence interval width, w.
The current version is available for download from the CRAN website or the package GitHub page. Please give any feedback, comments, or issues using the e-mail address listed in the package or on the package GitHub page.
Explaining phenotypic resemblance among relatives
R package nadiv
The R package nadiv, which loosely stands for (Non-)ADditive InVerses, was created to facilitate the estimation of additive and non-additive genetic variances using linear mixed effects models (often referred to as animal models). The package includes functions to compute the inverse of autosomal and sex-chromosomal additive, autosomal dominance, and autosomal epistatic (digenic) relatedness matrices from a pedigree. Other handy (at least I think they're handy) functions standardize some pedigree manipulation and simulation procedures.
Output from nadiv can be used by some mixed model software programs (e.g., MCMCglmm, WOMBAT, & ASReml). There are a number of other functions included in the package that are quite useful when dealing with pedigrees or running linear mixed models. For example, proLik() constructs profile likelihoods of variance components from an ASReml-R mixed model and aiFun() creates a (co)variance and correlatioan matrix from the sampling (co)variances of the random effects in an ASReml-R model object. Also, findDFC() will show you which pairs of individuals in a pedigree are double first cousins as well as indicate the number of families where you get these relationships. Knowing this information is useful for understanding the extent to which models can separate the effects of maternal, environmental, and genetic (additive and non-additive) sources of trait variation in a given pedigree (e.g., Wolak & Keller 2014).
The current version is available for download from the CRAN website or the package GitHub page. Please give any feedback, comments, or issues using the e-mail address listed in the package or on the package GitHub page.
Non-additive genetic variances
Wolak (2012) gives explanations for some of the main functions in nadiv. The paper includes Supplementary Information, which contains examples on how to use the output of nadiv in the mixed model software programs: MCMCglmm, WOMBAT, ASReml-R, & ASReml standalone.
Sex-linkage & Haplodiploidy
The R package nadiv contains functions to construct sex-chromosomal additive genetic relatedness matrices in the case of X or Z chromosomes. The relatedness matrices are analagous to the typical numerator relationship matrix (often referred to as A), but reflect the covariance among relatives as a result of the different inheritance patterns of sex chromosomes as compared to the autosomes. Note that this inheritance pattern is also the same as what would be expected in haplodiploid organisms (e.g., some insects such as bees and wasps)
The functions to construct the inverse of the sex-chromosomal additive genetic relatedness matrices implement algorithms I developed for different models of global sex-chromosomal dosage compensation (e.g., random X-inactivation). These algorithms are based on Fernando & Grossman (Theoretical and Applied Genetics 1990 vol. 80:75-80). With these matrices, researchers can estimate sex-linked additive genetic variances using a range of mixed model software programs that allow users to supply genearlized inverse covariance matrices (i.e., MCMCglmm, WOMBAT, & ASReml).
In addition, there are functions to trace the inheritance of the Y or W chromosomes and create factors to then use a mixed model to estimate the variance due to Y/W chromosomes.
Genetic groups
Quantitative genetic analyses using (generalized) linear mixed models and a pedigree can be expanded to account for genetic heterogeneity in the base population. Methods to account for these genetic groups can potentially be used to study microevolutionary change by separating genetic trends due to immigration from trends attributable to selection and/or drift. Further, these methods can reduce bias in estimates of additive genetic variance whenever pedigrees contain individuals with missing parents that do not come from the true founders of a population. These points and more are discussed in our Journal of Animal Ecology article and How To tutorials (Main text PDF | Supp. Info. PDF).
I have included two functions in nadiv to standardize and enable the implementation of genetic group methods across software programs. These two functions reflect the two approaches to include genetic group effects in a model (see our paper for more explanation). Genetic groups can be included explicitly in the fixed effects portion of a mixed model using output from the ggcontrib() function. Alternatively, genetic groups can be included implicitly in the specification of random terms by incorporating them into the inverse relatedness matrix that is linked to the additive genetic variance term. The function makeAinv() can be used to do this second method. Additionally, both methods can incorporate fuzzy classification of genetic groups (see more in the tutorial accompanying the How To article). Finally, the simmGG() function facilitates the simulation of pedigrees with associated data that have genetic group effects present.
Estimating net genetic effects that explain differences between populations
Line crosses between ...
Line Cross Analyses
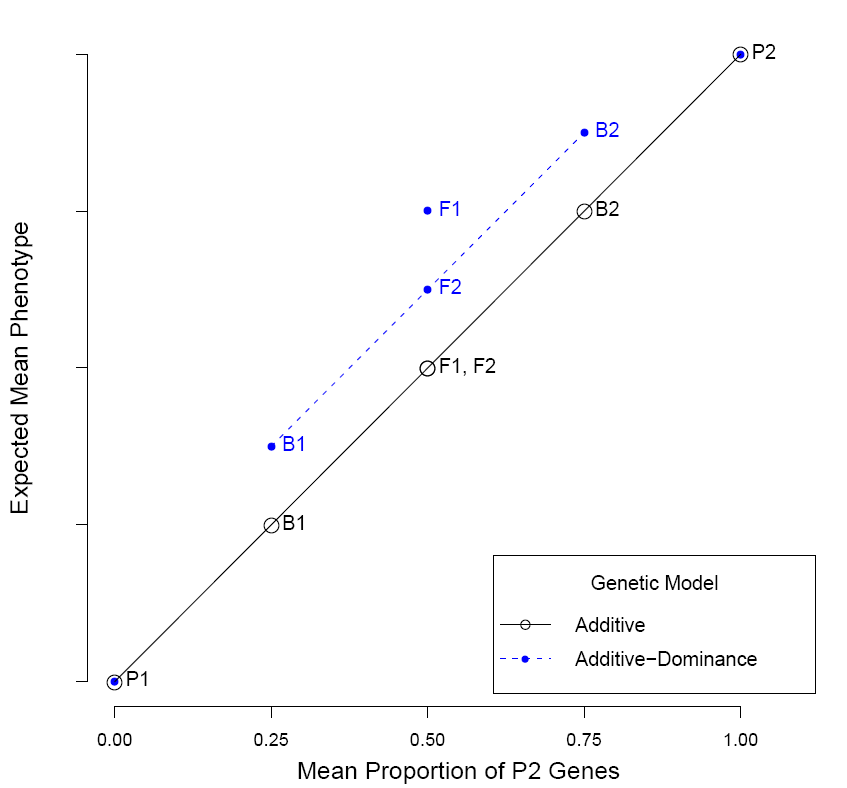
I am currently developing an R package to perform joint scaling tests. A joint scaling test (JST) uses the relationships between generation means of two parental populations, F1, F2, and backcrosses to estimate the magnitude and standard errors of net genetic components responsible for the differences in phenotype observed between two populations (further information in Lynch and Walsh. 1998. Genetics and Analysis of Quantitative Traits). JSTs are goodness-of-fit tests, assessed by least-squares regression, between the observed generation means and the expected generation means under a particular genetic model.
Functions in the package will include the basic joint scaling test, model averaging using an information-theoretic method (Akaike's Information Criterion), visual presentation of observed and modeled data, and a way to pick and choose modeled effects from among many genetic effects available. I will eventually have a preliminary version of the package on GitHub... Again, please send me any and all comments about what to include in this package.